
The figures, which are for the seven days to August 29, are based on tests carried out in laboratories (pillar one of the Government’s testing programme) and in the wider community (pillar two). The rate is expressed as the new number of new cases per 100,000 population. Here is the rate of new cases in the seven days to August 29 for the 13 Yorkshire areas with the highest rates of infection, followed by the equivalent figure for the previous seven days to August 22. Data for the most recent three days (August 30-September 1) has been excluded as it is incomplete and likely to be revised. Pictures are for illustrative purposes only.
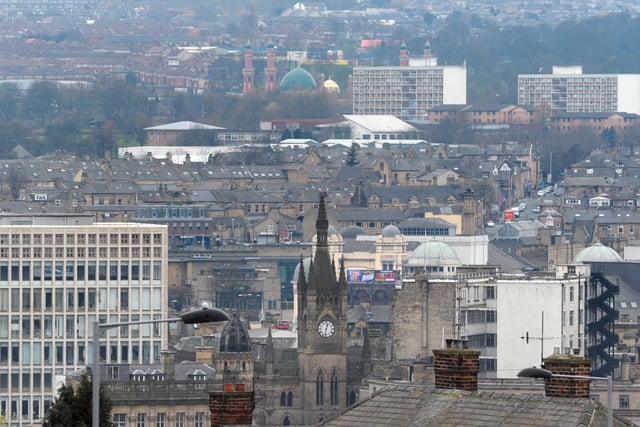
1. Bradford
Bradford had a rate of 53.4 (287 cases) in the 7 days to July 30, up from 46.9 (252 cases) in the 7 days to July 23
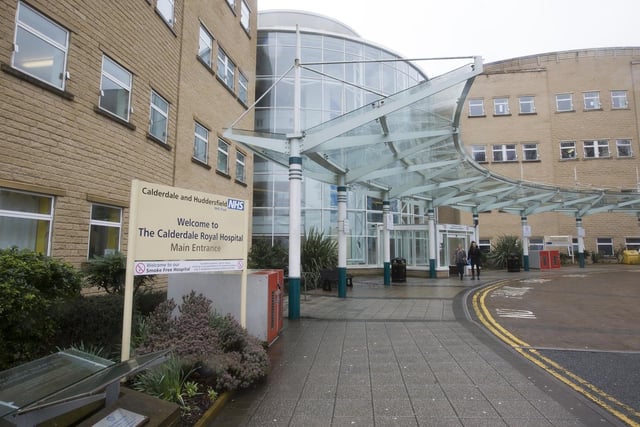
2. Calderdale
Calderdale had a rate of 41.9 (88 cases) in the 7 days to July 30, up from 23.3 (49 cases) in the 7 days to July 23
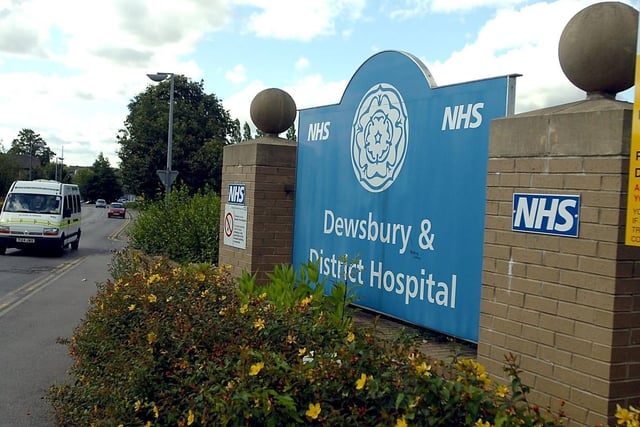
3. Kirklees
Kirklees had a rate of 22.8 (100 cases) in the 7 days to July 30, down from 24.8 (109 cases) in the 7 days to July 23
4. Sheffield
Sheffield had a rate of 17.2 (100 cases) in the 7 days to July 30, down from 17.9 (104 cases) in the 7 days to July 23